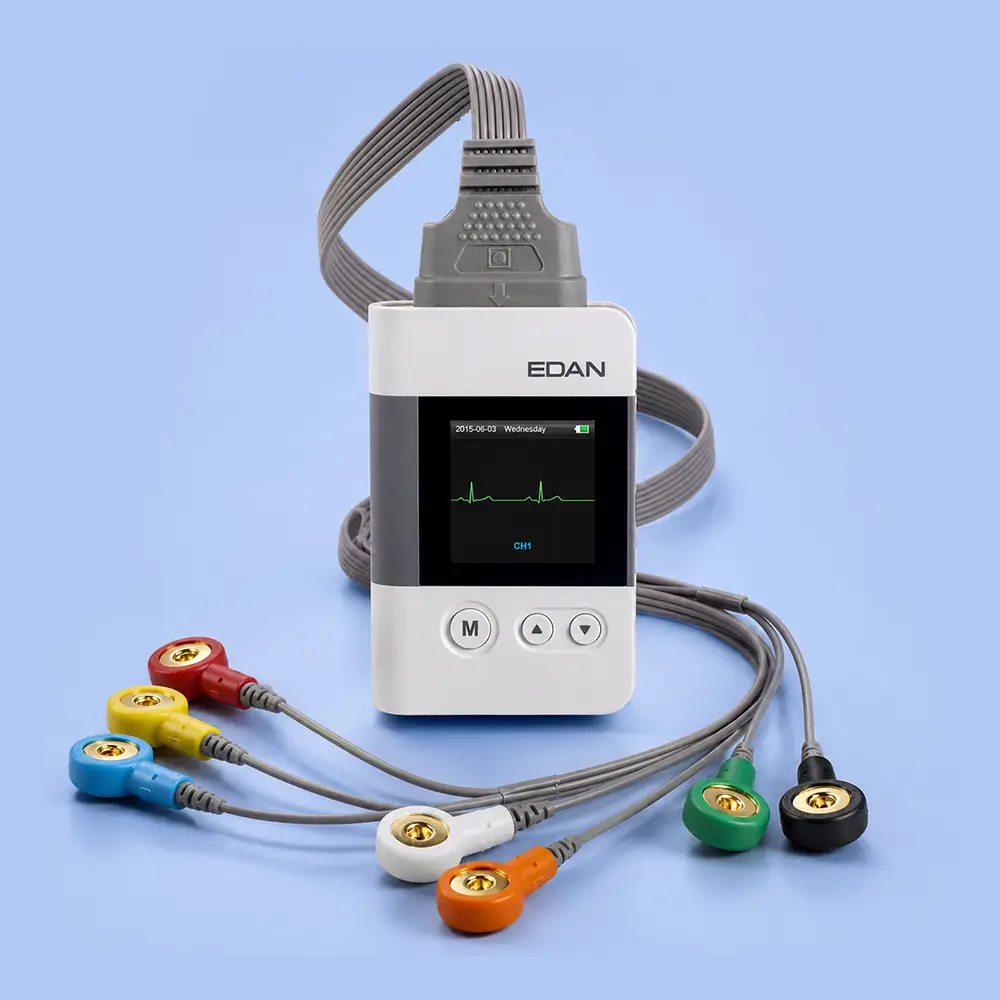
Description
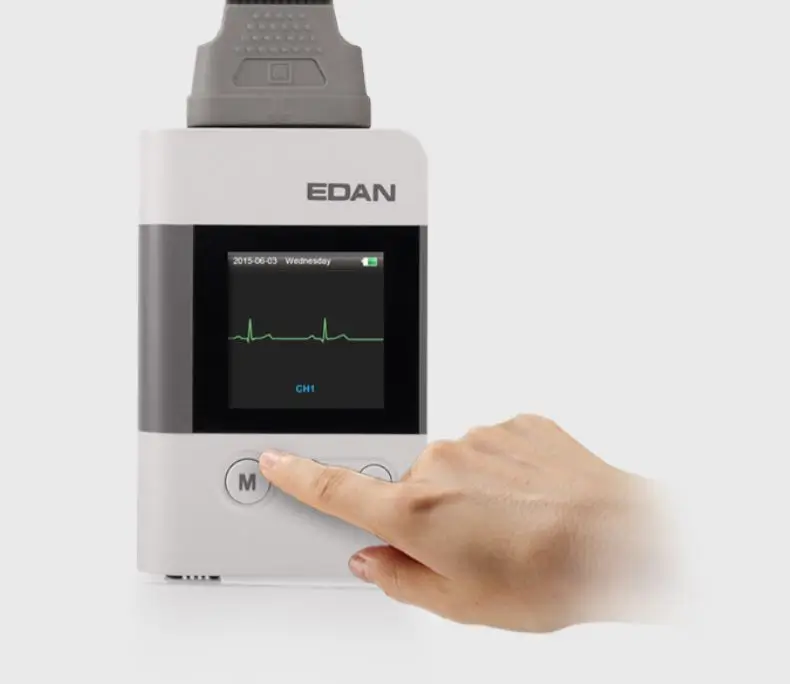
Event Marker
By pressing M on the device, special events can be marked on the recorded signals.
Thus, bringing needed attention to abnormalities in the signal when making a diagnosis.
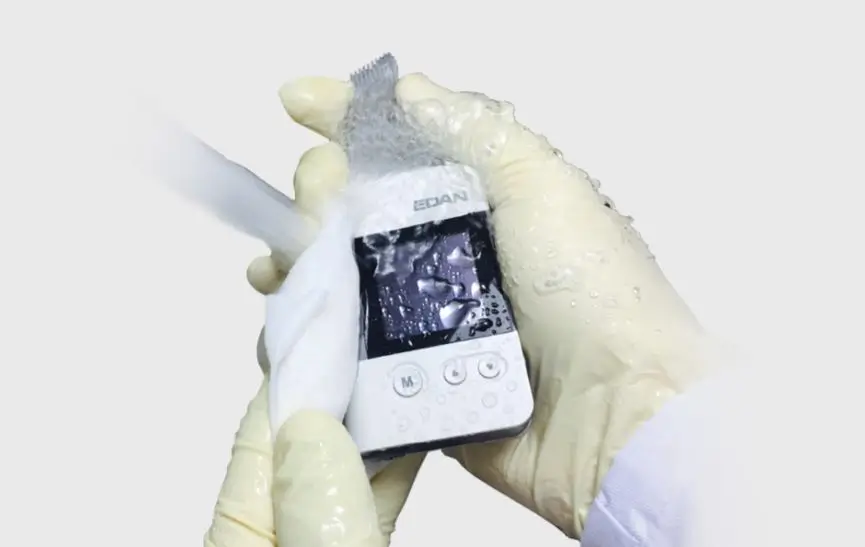
IP27 Waterproof Design
To ensure easy cleaning and to prevent accidental water damage.
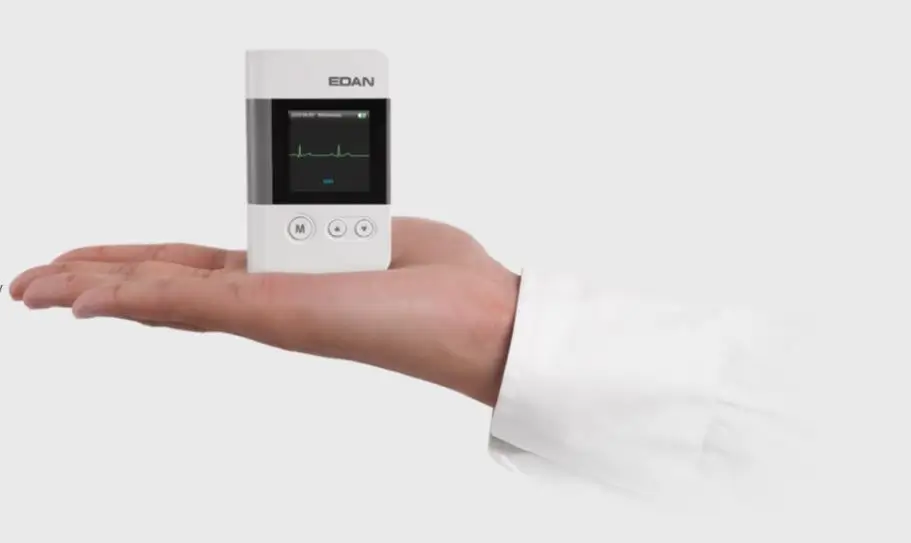
Lightweight Design
Weighing only 50g, the lightweight design gives the Se-2003/12 unmatched portability that does not hinder routine ECG tests.
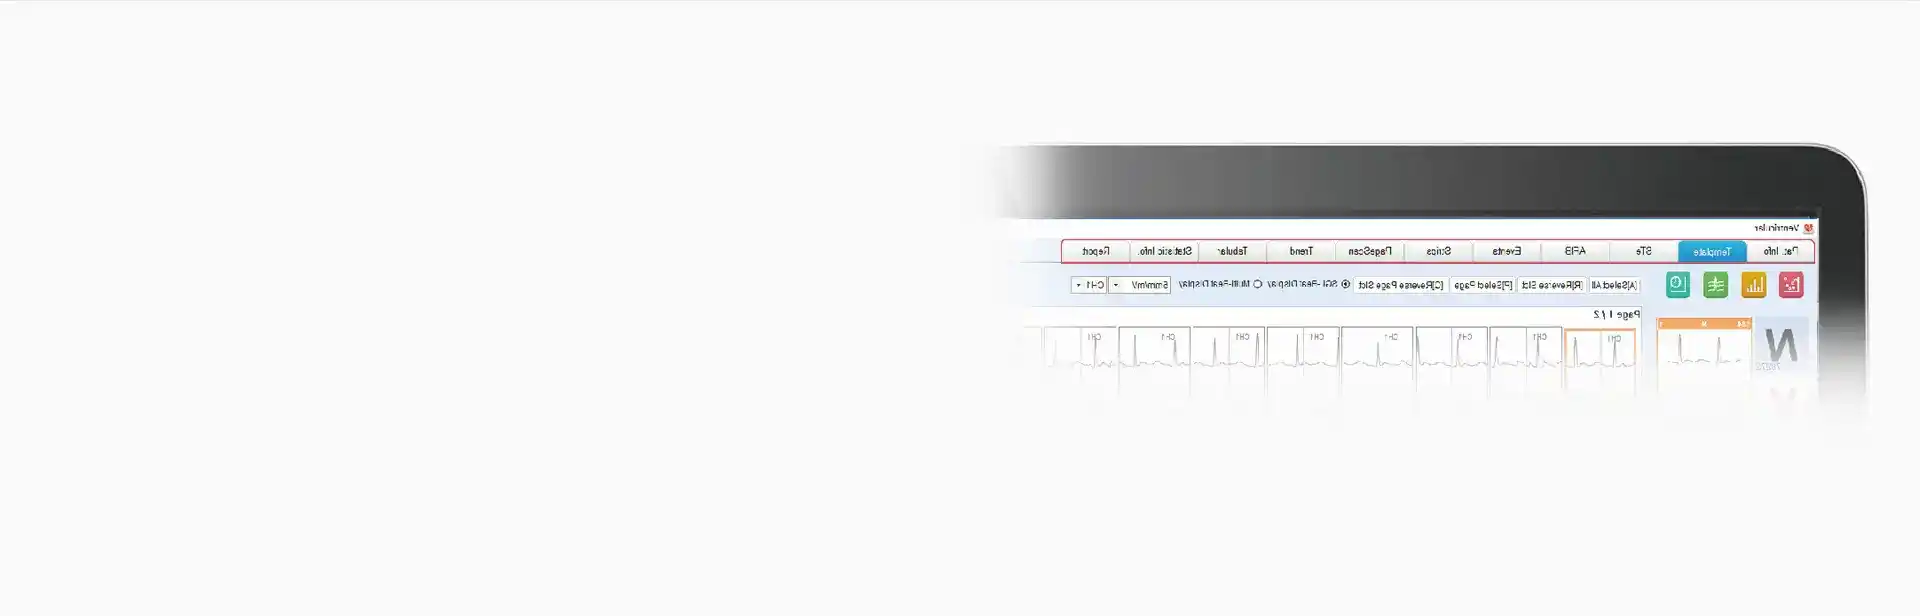
Redefine the Software to Fit Your Preference
Users can easily combine commonly used functions together. The top toolbar can also be customized based on preference. Thus, creating a personalized and comfortable workflow for every cardiologist.
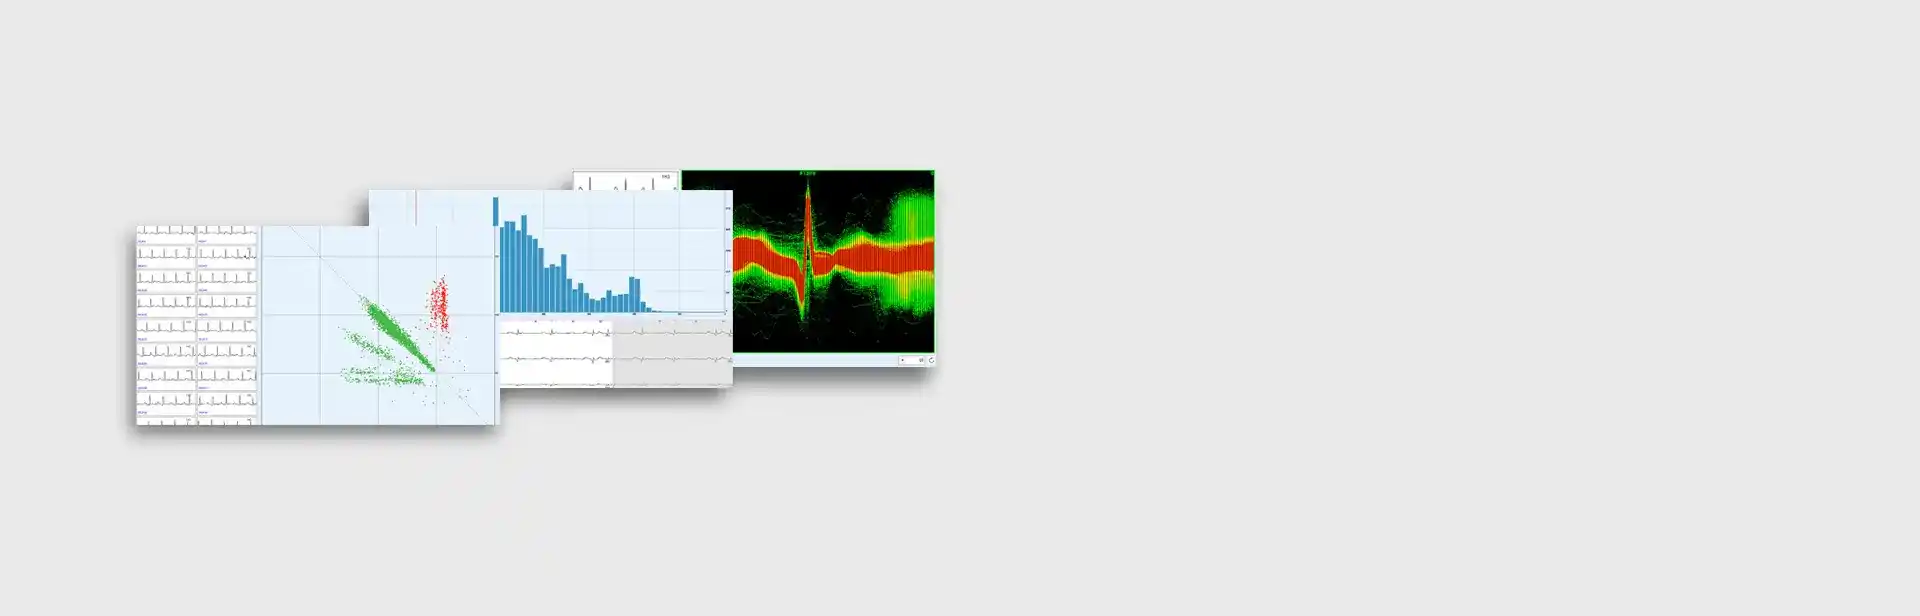
Assistant Diagnosis Tools
Finding distinct patterns and beats in the recording can consume much needed time. The software provides multiple graphical tools that help users locate and select abnormalities using corresponding graphical elements.
- The R-R Histogram presents the full group of recorded RR intervals, helping to locate unique heartbeats easily.
- The Waveform Superposition Heat Map exposes abnormal beats on overlapped waveforms.
- The Lorenz Plots (Poincare Plot) helps identify those beats with nonhomogenous beat-to-beat variability.
Extensive Analysis Tools


Reviews
There are no reviews yet.